
The Reporter’s 2016 Presidential Election Poll
Poll shows Stetson students are, somewhat unenthusiastically, ready for Hillary
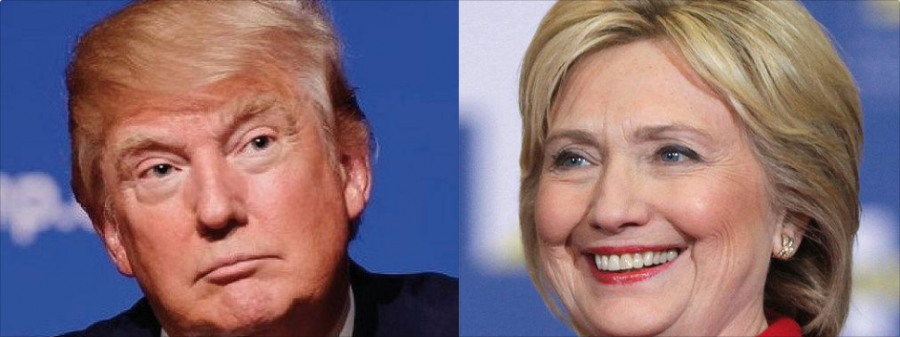
(Header: L-Donald Trump. R-Hillary Clinton. R-Photograph taken by Gage Skidmore)
October 18, 2016
This is part of a series examining the response’s to The Reporter’s 2016 Presidential Election Poll. For the responses from Hillary Clinton supporters, click here. For a look at Donald Trump’s supporters, click here. For the extra thoughts students shared regarding the election, click here.
The Reporter’s 2016 presidential election poll showed former Secretary of State and Democratic presidential nominee Hillary Clinton with a clear advantage over her opponents among Stetson students. The poll, conducted online from Sept. 14 to Sept. 25, closed with 49 percent of respondents choosing Clinton to be the next President of the United States. Despite her win, many students voting for her are not excited for her potential presidency.
Results
Over 95 percent of those polled confirmed that they would be voting in the coming election, which ends on Nov. 8. Only three students said they would not vote, and one of them explained they are ineligible. Five students replied that they remain undecided on whether or not they will cast ballots.
Clinton beat her Republican opponent Donald Trump by 22 points. Trump received 27 percent of polled voters. Third party candidates Gary Johnson and Dr. Jill Stein received 13 and 5 percent of voters, respectively. Just 7 percent of those polled, a total of thirteen students, were unsure of which candidate they would support this fall.
The poll shows that Hatters are much cooler than the general public on Trump, but in line with his support among younger Americans. As of writing, Trump holds just 26 percent of votes from Americans aged 18-29. Stetson support for Clinton matches her national estimate among millennials, at 49 percent.
Why we vote
Perhaps more interesting than which candidate students said they would vote for are their motivations. A plurality of students, 38 percent, said they would be voting to elect their chosen candidates, but that means a majority felt compelled by other reasons. Thirty-one percent said they would be voting to fulfill their civic duty, but 27 percent of students hope to prevent a particular candidate from securing the presidency.
For more information on why students are supporting their chosen nominees, see the following articles: Clinton. Trump.
Methodology
With 183 respondents, the poll reflects the attitudes of 6 percent of the student body. As a percentage of the total population, this is significantly higher than trusted pollsters such as Gallup and the Public Policy Center. Gallup states that it contacts 500 Americans per daily survey. Of course, the scientific nature of those polls is not in question. They randomly sample wide geographic areas, ensure that background information is tracked for internal numbers and use advanced statistical data to map the public’s feelings.
We, on the other hand, used a Google Form which provided instant data analysis and exported into a spreadsheet which allowed for tracking written responses and multiple choice selections. We did not collect any identification information from students.
The poll was pushed via Stetson’s daily bulletin service twice, and shared on The Reporter’s Facebook page twice as well. From there, others shared the link on Facebook of their own accord.